Providing leaders with unparalleled deep visibility at scale
In an increasingly complex world every organisation needs better visibility and understanding of its operations, systems, relationships, performance and impact.
We help you achieve improved visibility through your data and information by providing the tools and expertise to visualise and analyse structured and unstructured data in ways that are easy to understand and consume, leading to greater insight and informed decision-making.
The tools and approach we use overcomes the problem of accessing data from multiple data repositories and in different formats.
“It isn’t a step-by-step manual, or even a simply playbook. Instead we need to take the first step by seeing and understanding what got us here to weave together the threads of where we can go next.”
— Seth Gogin - The Song of Significance 2023
Our use cases include:
Mining
Legal
Health
Civil Construction
Circular Economy
Retail
Education
A typical project starts with a simple conversation to better understand the problem to be solved or questions to be answered.


Some examples of visualisation projects:
Health: Organisation operational services: In the health sector services can be delivered across multiple regions. Model’s of the current structure identified were services were being delivered to optimise resource utilisation and minimise capital expenditure.
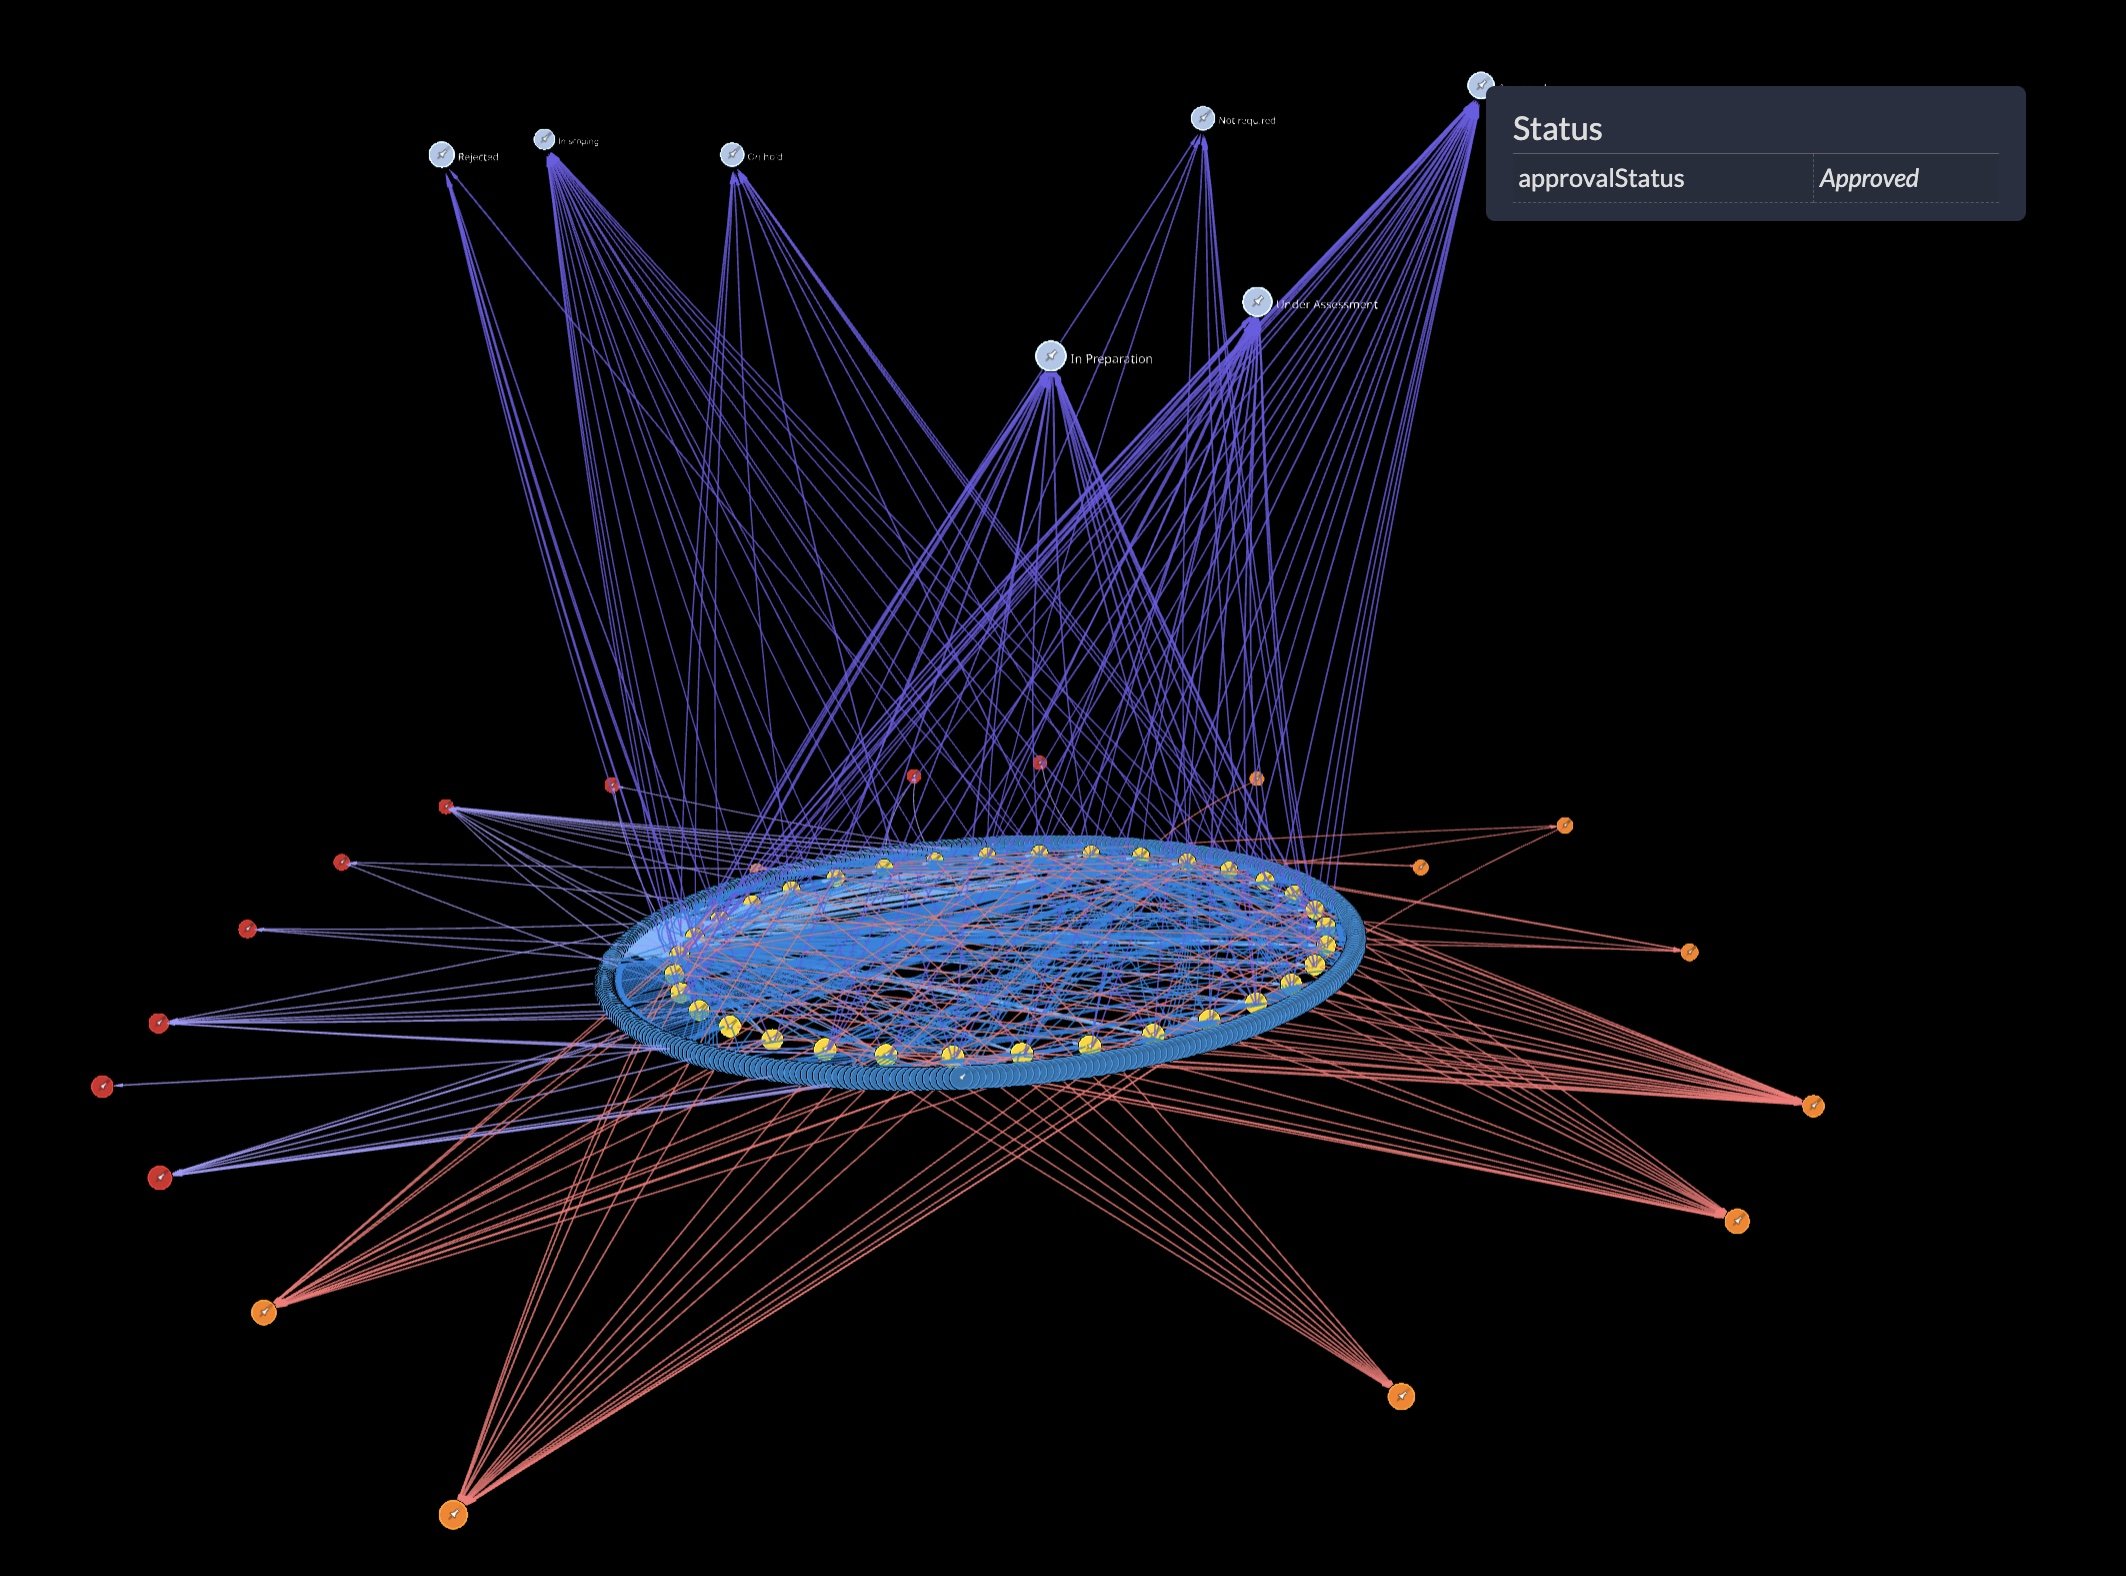
Mining: Within mining organisations the management of the ongoing license to operate is incredibly complex given the sequencing, timing, and coordination of approvals with multiple external parties. Any delay in their processing has a direct impact on the project timeline and therefore profitability. The visibility of approvals, status, resources allocated, dependencies, and potential delays allowed for better internal escalation and alternate planning.
Civil Construction: The understanding of dependencies very early in any major project can save considerable time and money. With an unfiltered and shared view all parties gain an appreciation of both scope and the complexity and this was communicated at all levels across the organisation.
Infrastructure: The ability to overlay multiple datasets from different systems, both internal and external, provides an informed perspective upon which better decisions can be made. A large infrastructure audit review was used a key resource to identify both quick wins and areas where more work may be required.
Legal: The visualisation of both structured and unstructured data allows key relationships to be defined and understood. One example of this was the search terms defined in a legal dispute to identify related material and to understanding who is communicating on the topic. This involved the use of fuzzy logic to optimise searchability. People, Organisations, Locations and Events , Key Dates, Decsions and Costs could be peiced togather with clear visibility of relationships and complex interactions.
Mining: Large Government data stores are incredible respositories to analyse and understand who is working with who. The Mining Tenement database from the WA Department of Mines defines all the tenement holders associated with every tenement, yet it is difficult to make sense of it. Visulaising the data allows visibility of patters, relationships and dependencies.
Retail: Transactional material from core financial systems was viewed in new ways to understand what items are typically purchased together and when. This aided in both logistics and store layout improvements.
Circular Economy: Modelling the Kwinana Industrial Precinct provided greater insight into the materials exchange and better understanding the impact of change.